Bezier Curve Explorer

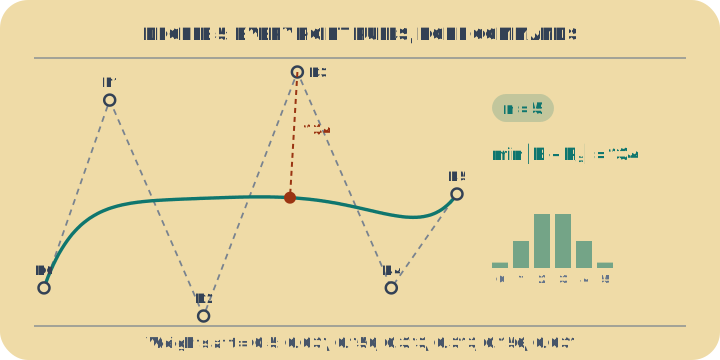
Explore Bezier curves interactively. Drag control points and see the de Casteljau construction.

Loading interactive simulation...

Bernstein polynomials and parametric continuity 🖖

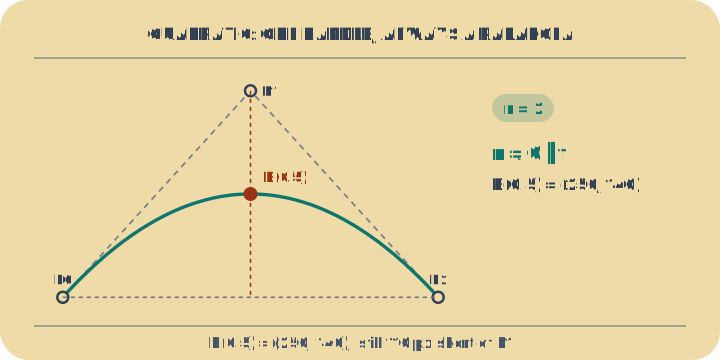
Bézier curves are parametric curves defined by a set of control points. Statically, they are expressed using Bernstein basis polynomials: B(t) = Σ P_i * b_{i,n}(t), where t ranges from 0 to 1. They guarantee spatial continuity, where the curve starts at the first control point, ends at the last, and is bounded by the convex hull of all control points, making them the standard tool for computer vector graphics.

Corner cutting with repeated averages 🖖

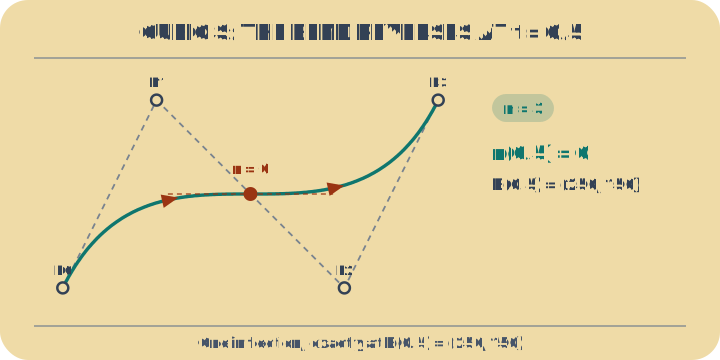
Behind the smooth curve is one humble operation repeated over and over: the straight-line average of two points. The de Casteljau algorithm takes your control points, finds the point a fraction t of the way along each connecting segment, then repeats on those new points until a single point remains — that is B(t). Drag the slider and watch the whole scaffold collapse to one dot tracing the curve.

Named after the wrong inventor 🖖

The algorithm this tool animates was created by Paul de Casteljau at Citroën in 1959, three years before Pierre Bézier published similar work at rival carmaker Renault. Citroën treated de Casteljau's research as a trade secret and kept it unpublished, so the curves took Bézier's name instead. Both engineers were shaping sheet metal for cars — the mathematics of fonts and animation was born on the factory floor.

Example problems