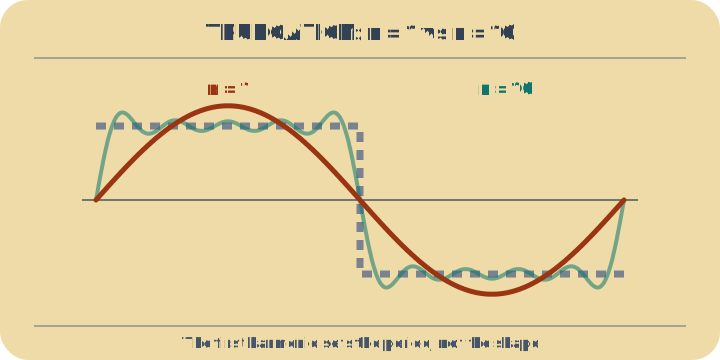
A Fourier series is the claim that any periodic wave, however jagged, is a sum of pure sines whose frequencies are whole-number multiples of one fundamental. The sum is built one term at a time and drawn over the target. The interesting word is equals: the sum reaches the target everywhere the target is continuous, and the Peak row is where you find out what happens where it is not.
What each symbol means
N- how many terms are being added. The slider stops at 20, and the series row names every coefficient it is using.
k- the harmonic index — which multiple of the fundamental a term carries. The square and triangle use odd k only; the sawtooth uses every k.
aₖ- the coefficient of harmonic k, printed in the series row. Its size says how much that frequency matters, and how fast the coefficients shrink decides how fast the sum converges.
Peakmax|fN(x)|, the tallest point of the partial sum. The target has amplitude 1, so this row is really asking: has the sum overshot?
Where the formula comes from
- Read the coefficients off the page. For the square wave the series row prints
1.273 sin(x) + 0.4244 sin(3x) + 0.2546 sin(5x) + …, which is 4/(kπ) at k = 1, 3, 5. Nothing is fitted — the coefficients come from an integral, and every waveform has its own.
- Notice which harmonics are missing. Square and triangle use odd k only, because both satisfy
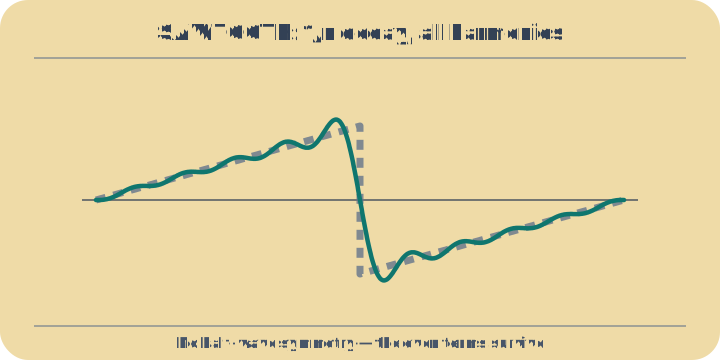
f(x + π) = −f(x): shift them half a period and they flip, and an even harmonic cannot do that. The sawtooth has no such symmetry, so it needs every harmonic — which the "Harmonics used" row states outright.
- The first coefficient already tells you the convergence speed. Square gives
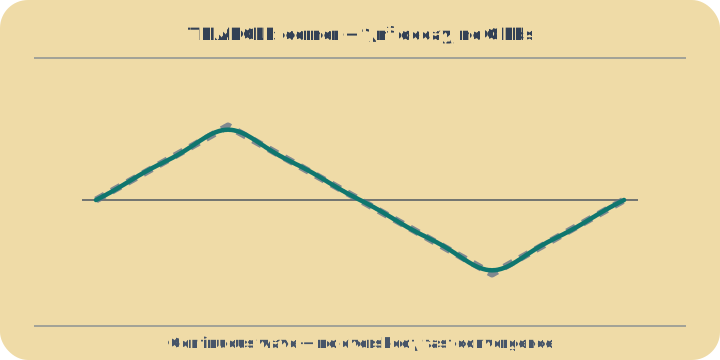
4/π = 1.273 and decays like 1/k; triangle gives 8/π² = 0.8106 and decays like 1/k²; sawtooth gives 2/π = 0.6366 and decays like 1/k. Faster decay means fewer terms for the same fidelity — which is why the triangle looks finished long before the other two.
- Now watch the Peak row instead of the picture. For a target with no jumps the peak should climb to 1 and stop. For a target with a jump, it does something else entirely, and that is the rest of this lesson.
How to read what you see
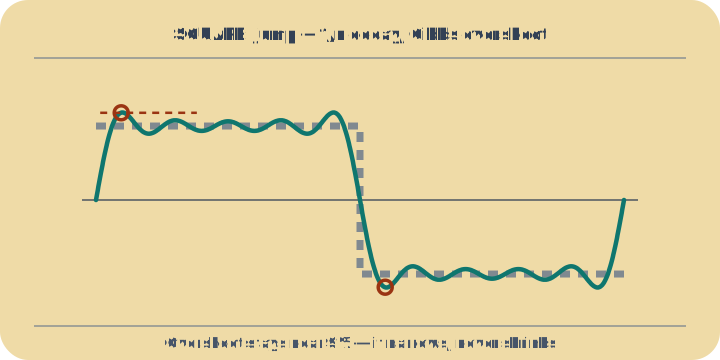
Set the shape to triangle and walk N from 1 upward: the peak reads 0.8106, 0.9006, 0.9331, 0.9596 … 0.9899 at N = 20. It climbs towards 1 from below and never passes it. Now switch to square: 1.273, 1.2, 1.188, 1.182 … and then it simply stops, at 1.179, and no further harmonic moves it. Finally the sawtooth: 0.6366, 0.827, 0.9185, then 1.008 at N = 5 — it crosses 1 — and by N = 20 it is at 1.131 and still climbing. Three shapes and three completely different stories in one row. The sawtooth is the one that misleads: watch it alone and you would conclude the overshoot grows without limit. It does not. It is heading for the same 1.179 as the square, just approaching from underneath.
- Assumes
- That twenty terms is enough to see the trend, and that the peak is found by sampling — the RMS row is evaluated at 801 points across the period, and the peak is the largest of those samples rather than a solved maximum. Both are fine for watching convergence and neither would do for a proof.
- Breaks when
- The overshoot never goes away. That flat 1.179 is not the series running out of patience: the limit is
(2/π)·Si(π) = 1.17898…, and adding harmonics for ever makes the spike narrower without making it shorter. So the series converges to the square wave at every individual point and never converges uniformly, which is the distinction the whole phenomenon exists to teach. It also explains an apparent contradiction on this page: the insight above says the overshoot is about 8.95% and this row says 17.9%. Both are correct — 0.179 measured against the amplitude of 1 is 0.0895 measured against the jump of 2. Michelson met the spike in 1898 on his own harmonic analyser and suspected a fault in the machine; Gibbs wrote to Nature the following year to explain that the mathematics was doing it, not the brass.