Z-Score Calculator

standardize values on the normal scale

Loading interactive simulation...

Affine Transformations 🖖

Z-scores map any normal distribution to the standard normal distribution...

One ruler for every scale 🖖

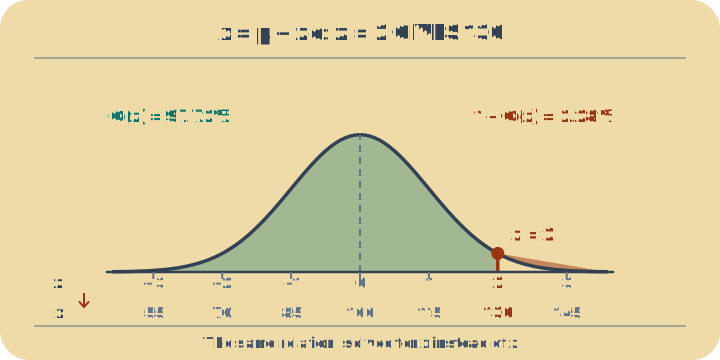
A z-score answers one simple question: how many standard deviations away from the average is this value? Because it strips out the original units, it lets you compare things measured on completely different scales — a mark out of 100 and a height in centimetres line up directly once both become z-scores. A value at z = 1.5 sits the same relative distance above its average whether it is an exam grade or a marathon time.

Small samples cap the z-score 🖖

When a z-score comes from a real sample of n values rather than a known population, no single point can exceed (n − 1)/√n standard deviations — a bound Ronald Shiffler proved in 1988. In a class of 10, the top score maxes out near z = 2.85, however brilliant; reaching z = 4 is impossible with fewer than 18 data points. A genuine 'one-in-a-million' outlier simply cannot exist in a small dataset.

Example problems

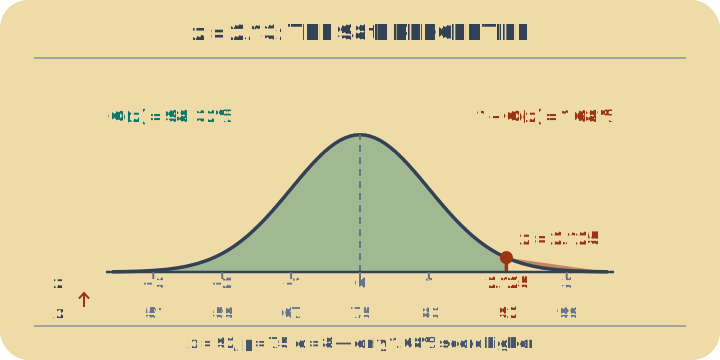
  • exam high (x=92) - An exam score of 92 with average 75 and standard deviation of 8. The score sits 2.13 standard deviations above the mean (98.34% percentile).
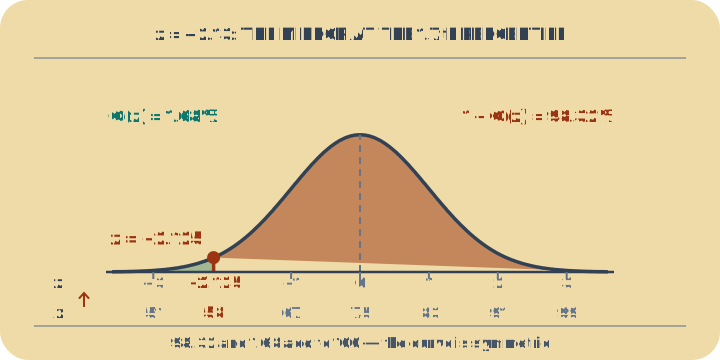
  • exam low (x=58) - An exam score of 58 with average 75 and standard deviation of 8. The score is 2.13 standard deviations below the mean (1.66% percentile), which is unusually low.
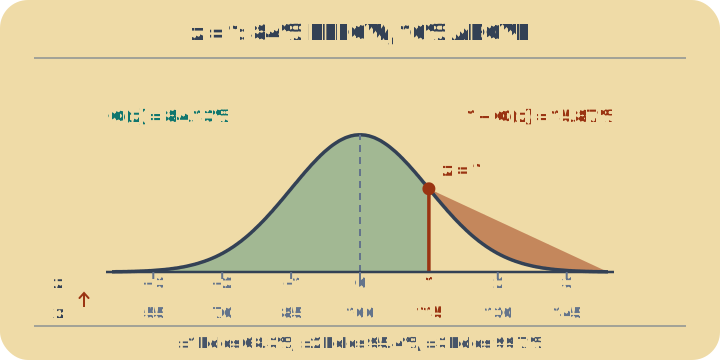
  • IQ 115 (z=1) - An IQ score of 115 on a standard scale (mean 100, standard deviation 15). This represents exactly 1 standard deviation above average (84.13% percentile).
  • IQ 145 (z=3) - An IQ score of 145 on a standard scale (mean 100, standard deviation 15). This represents 3 standard deviations above average (99.87% percentile), which is extremely rare (about 1 in 740 people).
  • height 190cm (z=2.14) - An adult height of 190 cm in a population with mean 175 cm and standard deviation of 7 cm. This is 2.14 standard deviations above the mean (98.39% percentile).
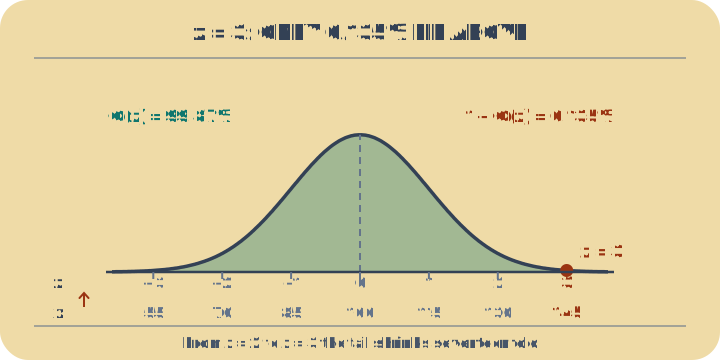
  • from z=2 - Calculating the corresponding raw value for a z-score of +2 in an IQ test (mean 100, standard deviation 15). The threshold is 130, representing the 97.72% percentile boundary.
  • from z=-1.5 - Finding the raw value for a z-score of -1.5 in a test with mean 50 and standard deviation 10. The result is 35, which sits at the 6.68% percentile.